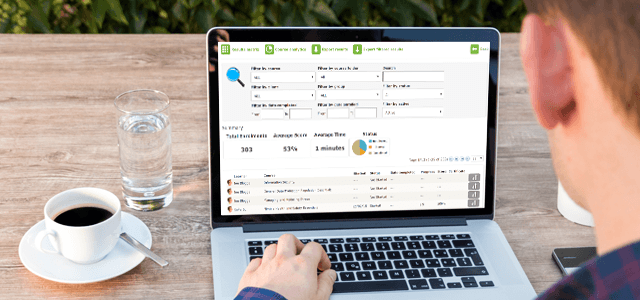
To paraphrase the old adage: data can be the thief of Time!
The solution to this particular crime is to use filters. Using filters can refine more than just coffee! Just like with your coffee, filters sift out what you don’t need and gives you what you do. With enough filters, you can also quickly change the sifting processes to analyse data differently.
The thing with data is that you can spend ages analysing it. It can appear amorphous and complex, and organising it into something meaningful can involve even more time; what’s more, the categories you use for one purpose may not suit the next one, so you go back to the beginning.
To get personal about this, I came to elearning from a ‘non-techy’ background, I knew little about it three years ago. I was ‘shown’ how to use Articulate and iSpring and when it came to the LMS I threw my hands into the air and screamed… a lot. I concluded elearning wasn’t for me on the back of this hysteria.
Then, after a Google search, I found Nimble. Sure, the authoring tool was a doddle and I loved that. When I came to understanding how to use the LMS, I threw my hands into the air again, this time screaming ‘Hallelujah!’ It was so easy to use and I didn’t feel stupid any longer.
What I liked most were the filters. They allowed me to screen what was relevant and what wasn’t. I could decide how to organise my learners in order to provide me with the data I needed. And I could do it all so easily!
If you’re wondering what filters to use, here are some ideas:
Groups (set up via the Learners tab)
- Archive
- Assessments
- Compliance
- Directors
- Evaluations
- External Clients
- Free Trials
- Learning & Development
- Logistics
- Shops or Branches
- Specific Training Roles
You can break these groups down still further, in another filter, perhaps into departments:
- Customer Service
- Distribution
- Individual staff (eg. if you’re organisation is an SME)
- IT
- Marketing
- Resource Planning
- Store Managers
Don’t forget also you can analyse the data more easily if you place courses into filters. This means you can categorise them and get a better understanding of their impact. Such as:
- Customer contact & relationships
- Geographical location (eg. districts, branches, countries etc.)
- Induction
- Safety
- Sales Mastery
- Surveys and evaluations
- Team Leaders
- Training events
Finally, when analysing the data, don’t forget that you can sift it by cross-referencing the filters, to get specific information. So, for example, you might select:
- GROUP: Shop branches
- DEPARTMENT: Customer Service
- COURSE: Geographical location
You can now analyse the data on how individuals in a specific shop fared with the ‘How to deal with a customer complaint’ – without taking ages to analyse spreadsheets. Add to that you can, with another filter, find out who has completed the course, who hasn’t – thereby holding people accountable without spending a long time poring over reports.
Remember you can also set up additional, bespoke filters – just let Nimble what you want to do.
Easy and speedy isn’t it? Probably faster than making filter coffee!
Phil Parker, Learning and Development Consultant, Nimble Elearning


0 Comments