
Although the vast majority of Learning and Development professionals recognise that collecting data and measuring impact are a priority (94% of L&D leaders want to improve how they approach this), only 18% are satisfied that they are successful (Towards Maturity, 2018). There are many models we can use to guide us in our approach to measuring learning transfer and business outcomes. Kirkpatrick’s model is probably the best known, with four levels to consider:
- Reaction: do learners enjoy training and find it relevant?
- Learning: do they actually learn anything?
- Behaviour: do they apply what they’ve learned in their job?
- Results: does this have an impact on organisational objectives?
This model has its detractors, and there are certainly many more to choose from: Thalheimer’s Learning Transfer Evaluation Model (LTEM) and Brinkerhoff’s Success Case Method are among the most commonly known. What they all have in common, however, is a focus on looking beyond the learner to evaluate what’s actually happening in the workplace. Is the learning intervention you so carefully designed and implemented making a difference where it matters? This is where data can step in. By carefully planning what to measure and how to analyse it, you can focus your efforts on the most effective approaches.
What types of data are we collecting?
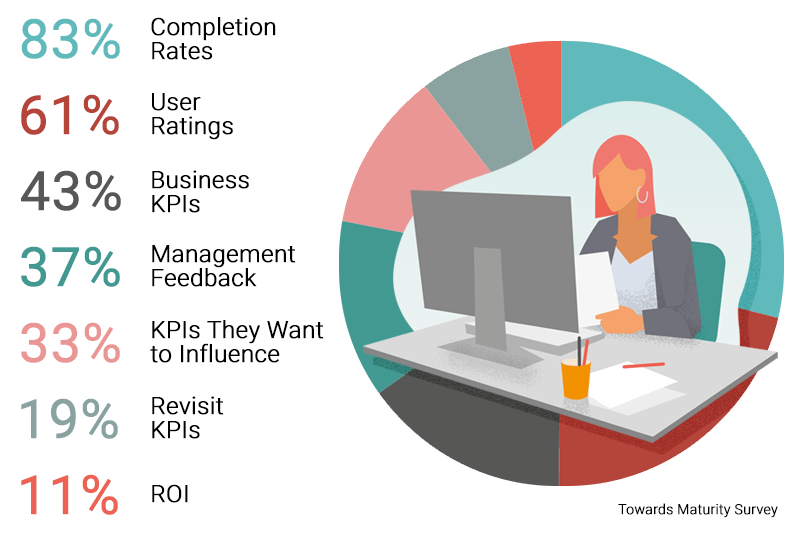
Looking at the research into what’s actually happening on the ground, the picture is a little disappointing. Towards Maturity’s survey found that while 83% of those polled were collecting data about course completion rates and 61% tracked user ratings, only 43% monitored business key performance indicators (KPIs) and just 37% collected management feedback. Focusing a little further on strategy, 33% identify business KPIs they want to influence, 19% revisit these, and only 11% measure the return on investment (ROI).
This suggests that the majority of L&D professionals are collecting quite superficial data. While most of us are confident with collating basic completion and user activity data from our Learning Management System (LMS), and in gauging user satisfaction using ‘happy sheets’, there is a long way to go if we want to realise the true power of data when it comes to measuring the impact of learning in the workplace. In essence, many of us struggle to collect and analyse the data we need in order to see beyond the first level of the Kirkpatrick model.
What types of data should we be collecting?
First things first: there’s no point collecting data for the sake of it. Your organisation will have unique objectives; before you make any decisions about what to measure, begin with your organisational strategy. With that in mind, let’s take a look at some of the metrics you may want to consider.
Data comes in two broad types: quantitative and qualitative. Quantitative data usually comes in the form of numbers, and can be easily compared or used in calculations. This type of data is the simplest to analyse, and can provide extremely valuable insights. Qualitative data, on the other hand, is a little trickier to pin down, but can be equally useful. This type of data might be in the form of open-ended responses, thoughts or feelings, and could be collected in surveys or interviews.
So exactly what might you measure?
- The time it takes for a new employee to reach productivity after they start, comparing those who’ve completed a new programme of learning and those who haven’t
- Productivity before and after a training programme, whether it’s number of tickets solved by a support technician, parts fitted by a mechanic, or outbound calls made by a contact centre representative
- Customer satisfaction scores, comparing two groups of employees who experienced different training programmes
- Number of health and safety incidents in the workplace, tracked alongside the introduction of a more comprehensive training scheme
- Employee retention scores, before and after introducing a mentoring programme
- Employee engagement and morale survey responses after rolling out a multi-faceted L&D strategy
- Line manager satisfaction with their direct reports’ performance, measured through surveys or interviews
All of these examples are clearly linked to key indicators that are important to the organisation. They move beyond measuring if learners have accessed a course, or clicked a smiley face to show that they enjoyed it; this data will help you demonstrate the impact of L&D on a much bigger scale. You’ll also notice that some of the examples given are comparing one set of employees with another who received a different training programme; this is a laser-focused, scientific way of demonstrating impact, known as A/B testing. Others focus on tracking changes before and after a programme is implemented. What’s important in all the examples is that they are clearly pinpointing an organisational need or concern, and answering a key question for leaders.
What are the barriers to using data?
How can we move beyond just a superficial glance at the data that is automatically collected by our LMS? Very few L&D professionals are data experts, and although we know that collecting and analysing data is of critical importance, it takes skill (and a little courage!) to identify how to improve this picture.
One of the key barriers for many of us is the need to access data that is outside the traditional realm of L&D. We may need to work collaboratively across the organisation; sales, marketing, HR, finance and operational teams might all hold data that could provide insight into the metrics we want to monitor. Unless your workplace has a genuinely open learning culture, this can be a real challenge. By presenting a compelling case for your need to access different types of data, you’re more likely to get other departments and managers on board.
Many L&D professionals cite concerns about data protection regulations or misuse of information as a major worry when accessing data they perhaps haven’t traditionally used. Ensure your own data protection training is up-to-date, and prioritise having frank and honest conversations with leaders about the support you need to ensure you’re following best practices. Responsible use of data is the duty of everyone in the organisation, not just the data controller. By accepting accountability and acknowledging when you need clarification or support, you can build trust across teams.
Moving from description to analysis
Having the data is all very well, but without analysis, it’s meaningless. This is the stage where we can fail to make the most of the information we have; often, that’s because we lack the skills to interpret it. If you’re more at ease designing learning or delivering training courses than conducting in-depth data analysis, you’re not alone in the world of L&D. Even Andy Lancaster, Head of Learning at CIPD, says in his book Driving Performance Through Learning:
“I don’t find data analysis comfortable territory; in fact, this section [Tracking Impact] was the one I was least looking forward to writing in the whole book.”
So what steps can we take towards getting a little more comfortable with data? Towards Maturity’s report emphasises an important point: start with the questions, not the answers. First, identify what you are hoping to find out. Then make choices about which data to collect and how to analyse it based on your objectives. Take care, though, not to impose your own biases on the data. It’s easy to cherry-pick examples to fit our own perceptions.
If you can, use expertise elsewhere in your organisation to help with interpreting data. You may not have direct experience or high-level skills in the L&D team (particularly if you work in a small business or charity and the team is just you!), but other colleagues may be more than willing to offer their assistance. To take your own skills to the next level, you might also want to consider taking one of the CIPD’s excellent courses on the subject of data and analytics. It’s also worth thinking about undertaking a benchmarking exercise, like those offered by Emerald Works (and discussed in depth in episode 244 of the Good Practice Podcast).
It’s not just about how you analyse the data. Presenting it in accessible, easily understandable formats can make all the difference when helping others in the organisation to see its importance. Would you rather read a page of facts and figures, or take a quick glance at a graph, dashboard or infographic?
Demonstrating business impact
When considering how to present data to senior leaders, it’s critical to bear their own priorities in mind. Ideally, the L&D department strategy should be tied into the organisation’s aims as a whole. If you’re not quite at this stage yet, ensure you identify what management perceive as the biggest challenges they are facing, and what their objectives are (in the short and long term). If you can demonstrate how workplace learning is addressing these issues and striving to meet organisational aims, leaders will sit up and take notice. It can be easy to feel you need to justify the money spent on L&D, focusing on cost effectiveness; aim higher! Investment in learning has a positive impact on the organisation as a whole. The data you present should highlight this. LinkedIn’s 2021 Workplace Learning Report found that 63% of L&D professionals worldwide felt that their discipline was on the radar of senior leadership as critical for business success, up from just 24% at the start of 2020.
Data also gives us the opportunity to be strategic about learning needs. By collecting and analysing performance data over time, we can begin to identify the weaknesses in the organisation and plan for learning opportunities (whether coaching, mentoring, job aids for learning in the flow of work, or more formal elearning courses). It’s an unfortunate truth that many L&D departments are perceived by senior management as being reactive rather than proactive. Harnessing the right types of data can help you get ahead of the curve.
Of course, once you’ve identified the need and designed the learning opportunity to address it, the true measure of success comes much later: has performance improved? By asking the right questions and focusing on the data that’s relevant, you can begin to demonstrate impact over time and show the true value of building a learning culture. Keep quality data analysis at the heart of your L&D strategy, and you can elevate your influence in the organisation.

0 Comments